12 min read
I want to introduce you to the Inference Investment Theory (IIT):
Inference is variable machine labor. The more useful machine labor you fund, the more value the system could return. Spending creates the capacity. Measurement tells you whether the capacity became value.
IIT in Plain English
IIT is a theory of software production. It applies when machine capacity can perform material engineering work and accepted value, total cost, quality, and risk can be measured. Safety-critical, regulated, and infrastructure workloads keep their validation and control requirements. Those requirements define acceptance; speed does not erase them.
Most readers also read: If you cannot afford the tokens, can you afford to build it?
Within that boundary, the objective is not minimum inference. It is the optimal ratio of machine capacity, human judgment, and value-stream investment that produces the most accepted value at stable quality and risk.
The business rule is simple: invest another dollar when it creates more accepted value than it adds in total cost, with quality and risk inside the boundary. Stop when it does not.
Look at how most companies manage inference. I’m sorry if this sounds familiar…
It’s Tuesday after the staff meeting. Another email. Another memo. Another meeting about the AI bill. By Thursday, you suspect the company does not actually want you using AI. It just forgot to cancel the AI mandate.
The CEO says every team must become AI-native. Procurement says to limit approved tools to business-critical work. Finance adds AI Consumption Review to your calendar. You are waiting for the next email asking employees to turn off the lights and shut down their computers at lunch.
The transformation is mandatory. The inference is optional. Use AI everywhere. Just do not use enough AI to create an invoice.
Finance opens the meeting with the accusation: “We spent $100,000 on AI last month.” Procurement recommends lower caps. Someone asks whether the expensive models can be blocked. Nobody asks what shipped faster, what improved, what delay disappeared, or what the work cost before AI.
That is how procurement ends up driving your AI strategy. Engineering brings anecdotes. Leadership brings a mandate. Procurement brings an invoice. The invoice wins.
Can you spend less? Of course. Spend nothing. Revoke the accounts and achieve the cheapest AI transformation in history. Finance gets a green arrow. Engineers return to manual work. The board still hears that adoption is on track.
That $100,000 may be reckless. Across 10,000 developers, it is also $10 per engineer for the month. The invoice cannot tell you whether you funded transformation or starvation.
Meanwhile, procurement accepts the CRM provider’s published $350-per-user monthly list price for a 10,000-person sales organization. That is $3.5 million a month. Nobody circulates a responsible-CRM-use memo. CRM is a familiar seat, so the invoice feels disciplined. Inference is a production input, so $10 per engineer feels dangerous.
Then someone blocks the models engineers say complete the work. The cheaper model produces a weaker result, the engineer spends two hours correcting it, and the savings slide still turns green because human rework is buried in payroll. What everyone wants is AI without the cost of AI.
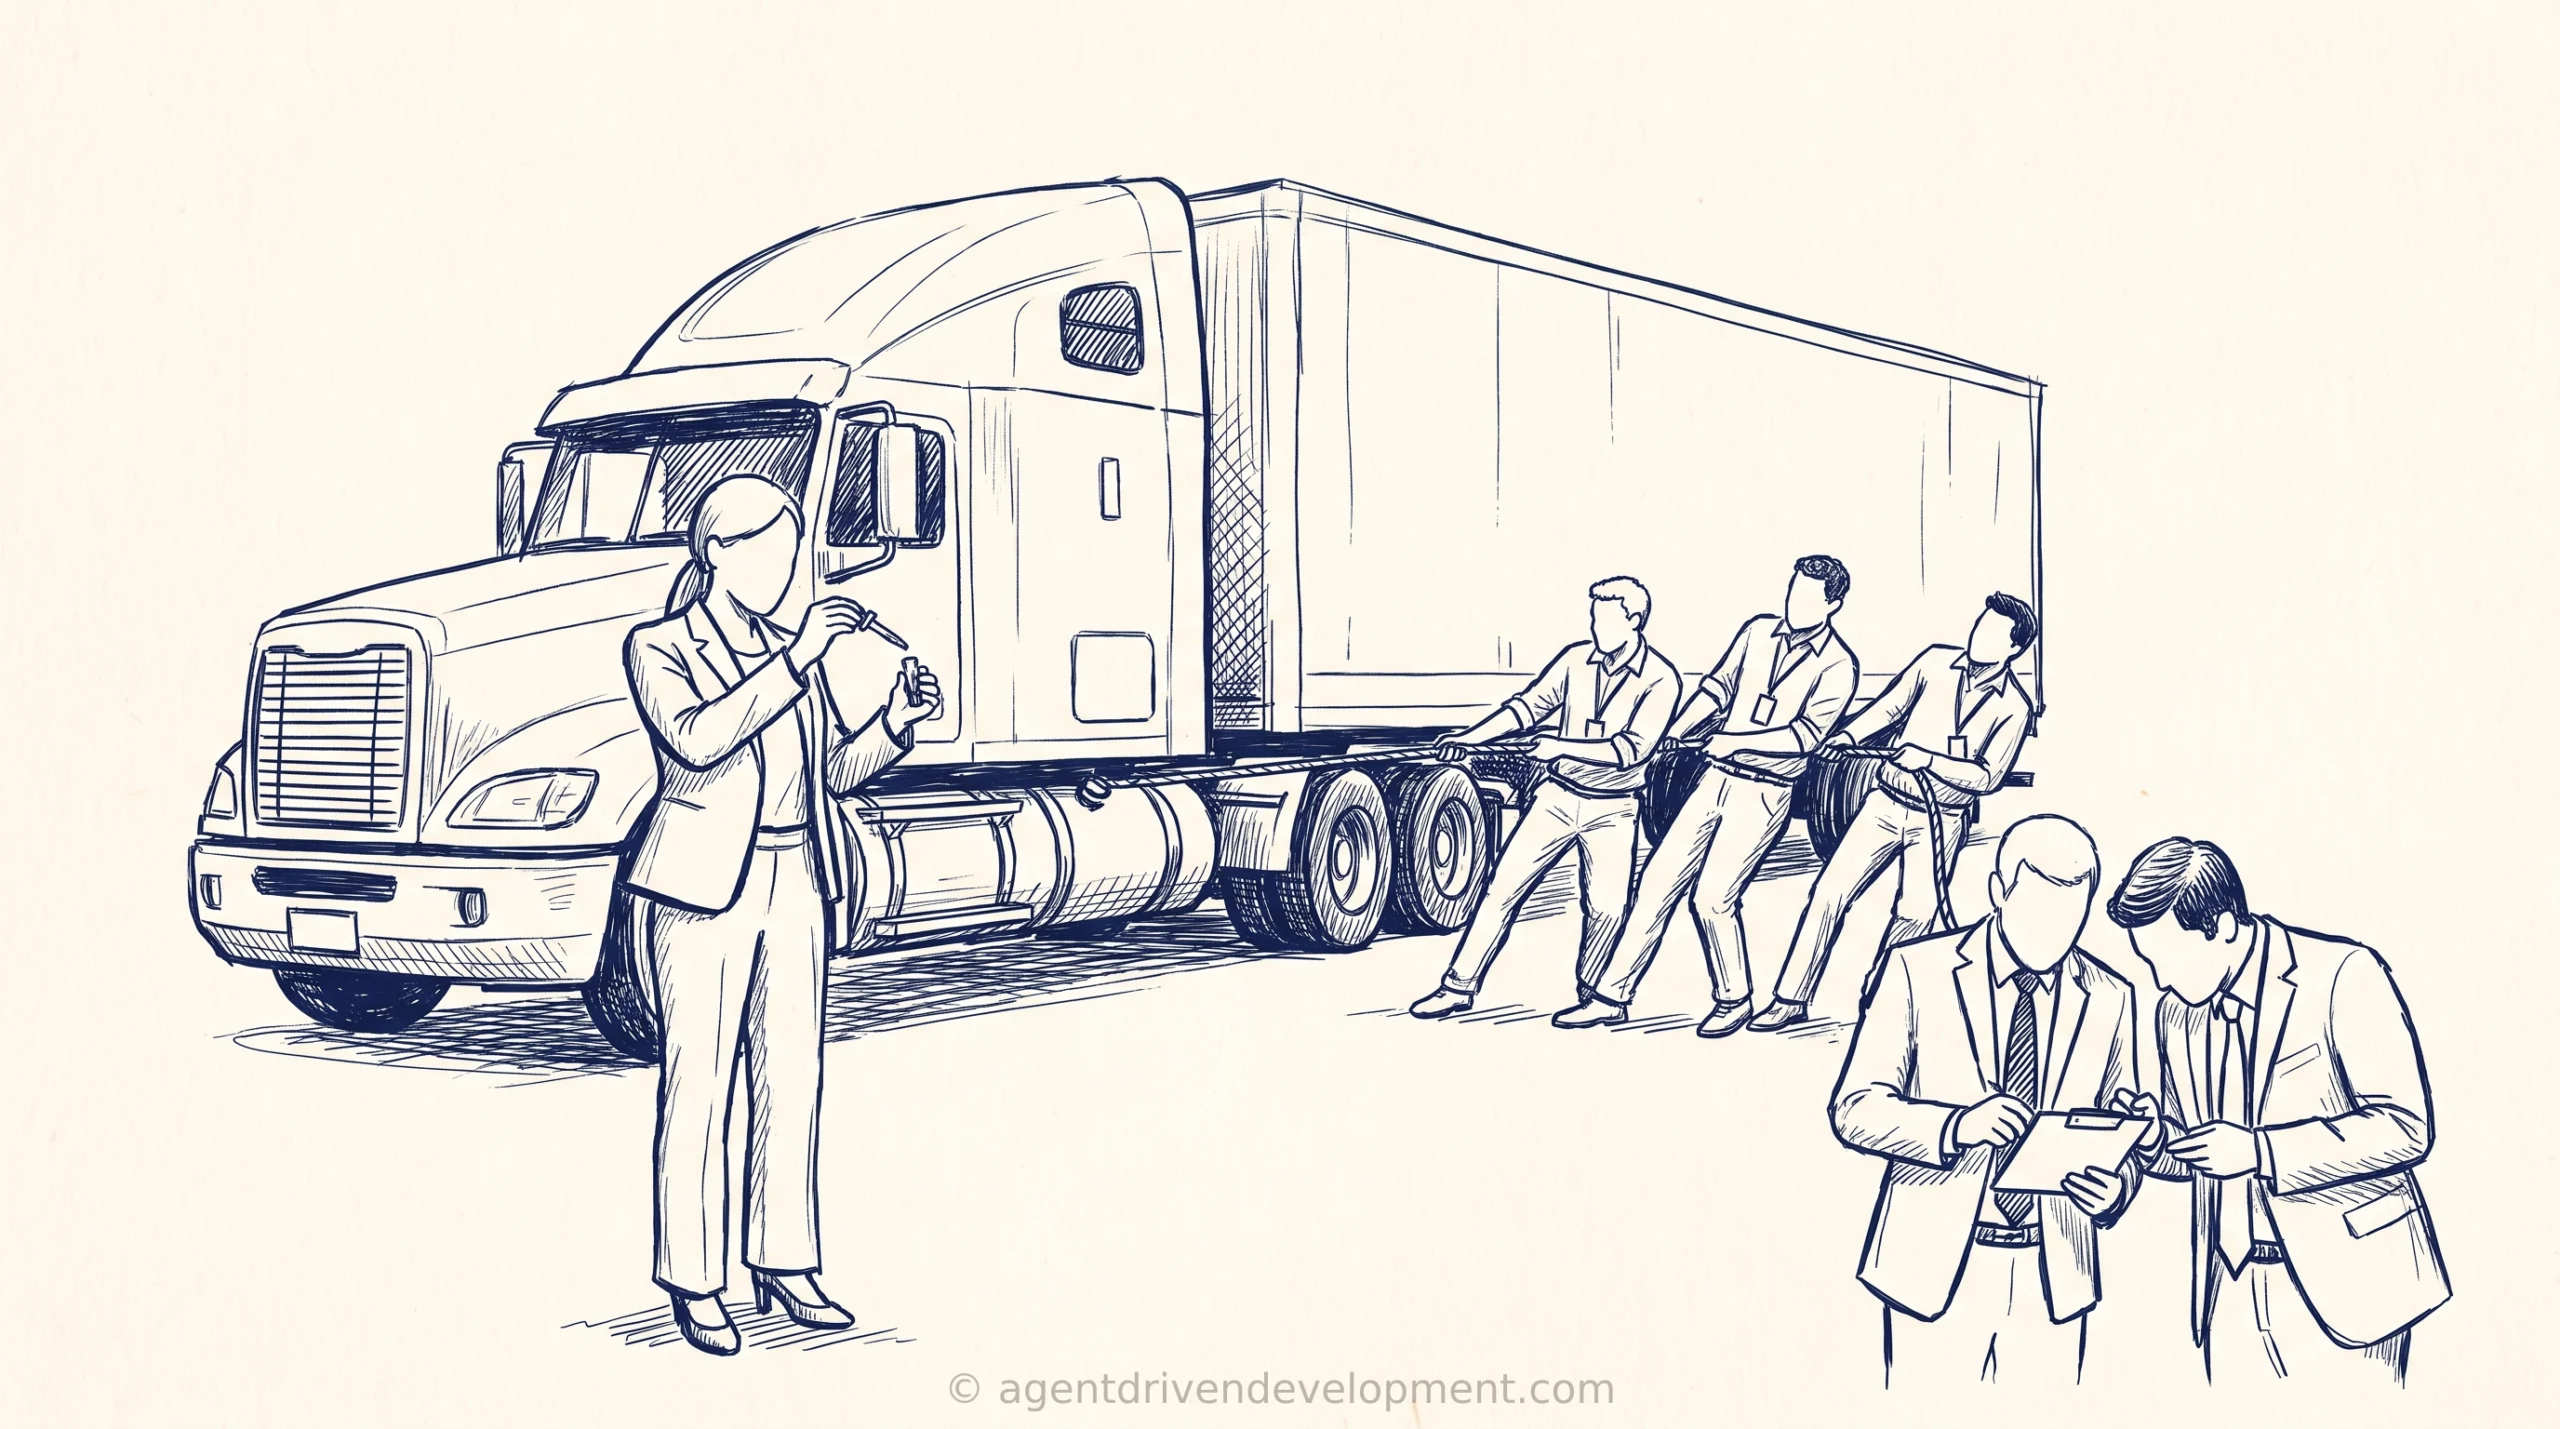
It’s like you’re running a trucking business, but each driver gets one gallon of gas a month. Once the gallon is gone, the driver climbs out and pulls the trailer by hand. Fuel spend looks fantastic. Freight stops moving.
The serious question is not whether fuel costs money. It is whether the fuel moves enough accepted freight to improve the economics of the fleet. If fuel costs 50% of driver labor and the fleet delivers twice as much, that can be a good investment. If fuel costs 1% and freight doubles, that is extraordinary, and worth checking whether freight, distance, damage, and delivery standards were measured honestly.
We are moving toward a software industry where the skilled operator may cost less than the machine capacity that operator directs. The engineer becomes the pilot of a production system that can consume more inference than the engineer earns in salary.
That is not strange economics. Airlines do not insist that aircraft, fuel, maintenance, and airport operations stay below 5% of pilot compensation. Medical imaging equipment can cost more to buy and run than the trained professional operating it. Human judgment is valuable because it directs an expensive machine toward a safe, accepted outcome.
Software leaders are not used to this. Labor was the production cost and tools were a rounding error. Agentic development may reverse that relationship. Limiting inference to a polite fraction of salary could soon look like grounding an aircraft to protect the fuel budget.
You still have to manage the whole value stream. Agents can turn ten days of implementation into two while the release waits three weeks for architecture, security, and change approval. The machine did its job. The organization confiscated the gain.
Modern governance does not mean less control. Architecture, security, testing, and change approval earn their place when they produce evidence and reduce material risk. The waste is undifferentiated review, idle queues, repeated handoffs, and controls that arrive after the value expires. Put automated evidence and clear risk tiers inside the workflow. Preserve the judgment that protects production. Remove the waiting that protects nothing.
For suitable software workloads, inference is probably the cheapest, fastest way to produce another unit of engineering work available to you in 2026. That makes every blocked review, overloaded test environment, and quarterly release window more expensive because cheap machine capacity reaches the constraint faster. Fund the machine. Then rebuild the value stream so the capacity becomes accepted product value.
This was easier before AI. Developer tooling arrived as a predictable seat. Inference is metered, so every productive session makes the visible number worse. Procurement is not malicious. It sees the bill, but not the delay removed, defects prevented, or customer value shipped. The management system awards a perfect score for zero inference.
Your dashboard is no help if it shows only headcount, deployments, defects, and incidents. You gave procurement a receipt and asked it to manage a production system. It did what receipts are for. It tried to make the total smaller.
IIT Is a Return Curve, Not a Budget Ratio
Here is a deliberately simple hypothetical test. Start with $100 of labor producing 100 units of accepted output. Add $50 of inference and produce 200 units. Cost rises 50%, output rises 100%, and cost per accepted unit falls from $1.00 to $0.75. That is a good trade.
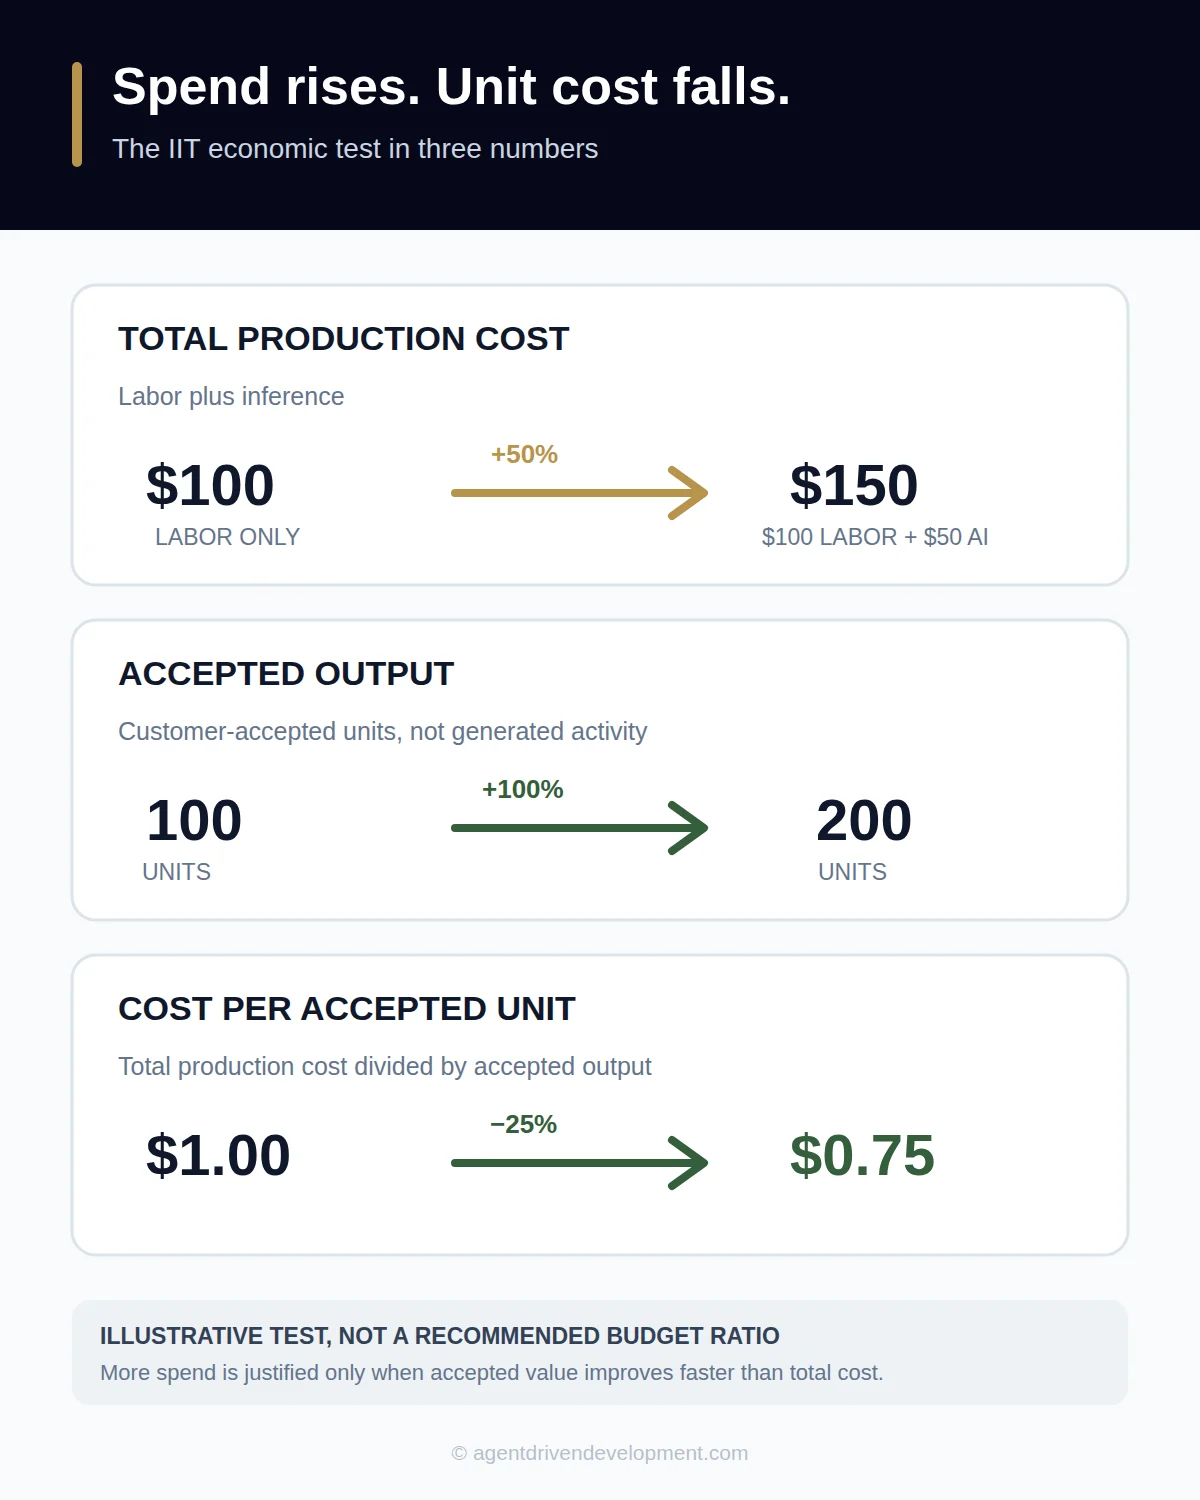
The IIT question is not whether inference adds cost. It is whether accepted value improves faster than total cost.
The ratio works both ways. More inference can increase accepted output with the same team, or preserve it with less labor. The released capacity can support growth, higher-value work, avoided hiring, fewer contractors, or fewer roles. Leadership must state which result it is funding and manage the workforce consequences openly. The arithmetic is not the workforce strategy. Hiding the workforce strategy is not governance.
Now add $1 of inference and claim the same gain. That would be extraordinary, but it is not a credible portfolio benchmark without scrutiny. Maybe you counted generated code instead of accepted software. Maybe quality fell. Maybe a few exceptional engineers carried the pilot.
You should hope for the 1% miracle. You should not call it a benchmark. A benchmark produced by a starved system mostly measures starvation.
That is what IIT predicts: an underfunded system cannot reveal its optimal ratio.
At 1–5% of labor cost, you may prove a bounded workflow. You cannot assume that result describes a portfolio where agents perform a material share of production. You did not test transformation. You tested assistance under a small fuel allowance.
The CFO will call this a blank check. It is not. A staged investment measured against product outcomes, TCO, and Cost of Delay gives Finance something it rarely has in engineering: an input that can be increased, observed, and reduced without reorganizing the company.
The CTO will say the delivery system cannot absorb more machine output. Good. Now you found the constraint. Apply the machine to tests, review, documentation, compliance evidence, and deployment. Fix the road. Do not drain the fuel tank because the loading dock is slow.
The COO will point to a brilliant 1% pilot. One fuel-efficient route does not prove an entire fleet can run on one gallon per truck. A pilot tells you where the machine works. It does not tell you what the operating model requires.
Invest in stages. Fund enough inference to change how the work is done, then measure the stage. Increase it while accepted output rises, TCO or Cost of Delay falls, and quality and risk remain stable. That is how you discover the return curve instead of inventing one from an underfunded pilot.
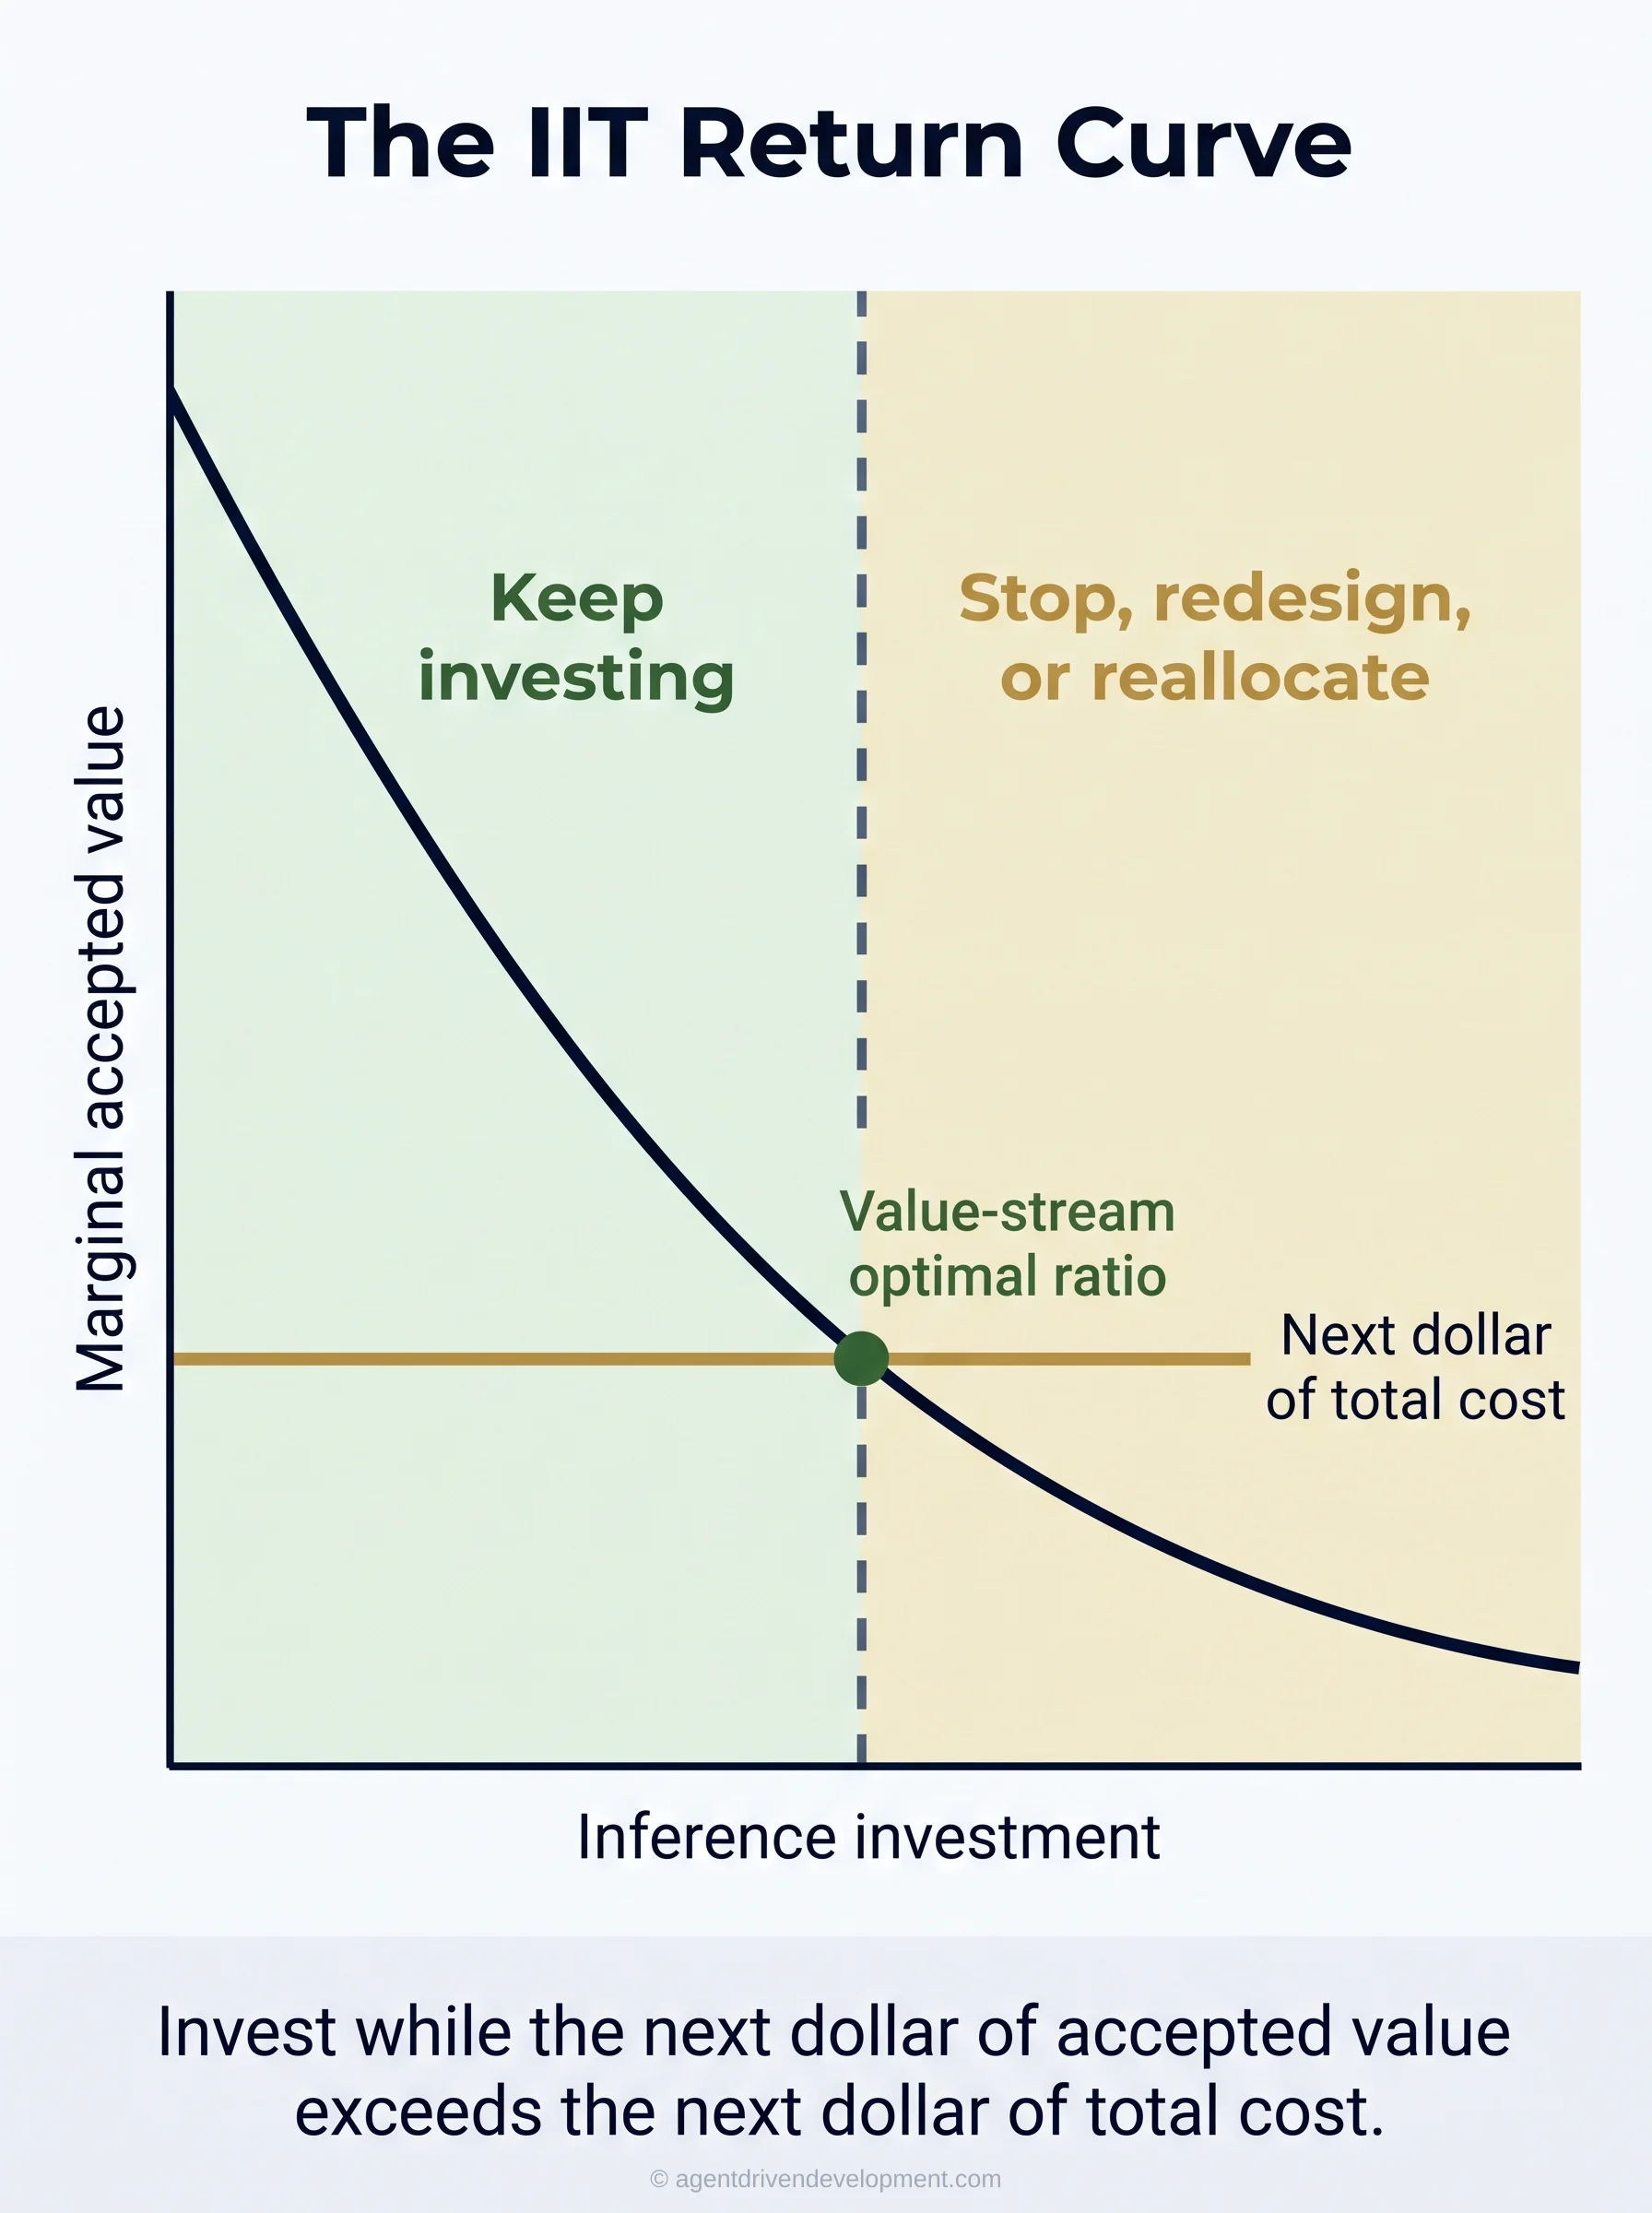
The optimal ratio is discovered one value stream at a time. A 1–5% pilot may prove assistance without revealing the return curve.
The rule is simple:
The objective is not minimum inference. It is a better product delivered faster at a lower total economic cost.
Your dashboard needs two layers. The first contains the measures that would matter if AI disappeared tomorrow. The second shows how much inference you invested to move them.
Both layers sit inside a non-negotiable evidence standard. Track escaped defects and severity-weighted security findings. Record model versions and input-data provenance, the path from generated work to accepted production, and the evidence behind every approval. Track compliance exceptions, failed changes, incidents, and recovery work. Stable aggregate counts do not qualify if critical risk worsens or required evidence disappears. Acceptance criteria and experiment cadence must conform to the safety, privacy, labor, legal, and regulatory obligations of that value stream.
These measures belong at the product, team, and portfolio level. They are management instruments, not individual performance scores. I have argued that token economics is the wrong spreadsheet when it tries to prove the ROI of every prompt. That argument still stands.
Metric One: The Product Outcome
Every product exists to move a number: checkout conversion, renewal, revenue, cost to serve, time to resolution, retention, or risk removed. Pick the outcome the release was funded to change. Record the baseline and define the acceptance, quality, and risk guardrails before production.
This is where “double the output” has to survive reality. Twice as many lines, pull requests, story points, or deployments is not twice the output. If customers did not receive more value, you produced more activity.
Metric Two: Cycle Time to Accepted Production
Cycle time = accepted production date − approved work date
Use the median across comparable work. Include planning queues, implementation, review, security, testing, release waiting, and acceptance. Starting at the first commit makes the months before it disappear.
AI may cut implementation from ten days to two while the release still takes twenty weeks. The full cycle tells you whether the machine changed the system or merely delivered work faster to the next queue.
Metric Three: TCO per Accepted Release
TCO per accepted release = total delivery and operating cost ÷ accepted releases
Include fully loaded labor, inference, platforms, coordination, review, rework, recovery, and an agreed operating window. Compare the same product or release class so smaller batches do not make the number lie.
If $100 of labor plus $50 of inference produces twice the accepted output, spending rises while unit economics improve. I have made the complete TCO argument here.
Metric Four: Cost of Delay
Cost of Delay = expected value per week × weeks delayed
Suppose a release is worth $100,000 a week and arrives eight weeks late. Cost of Delay is $800,000. If $200,000 of inference removes four weeks, you spend $200,000 to protect $400,000 of value. That is easier to defend than a cheaper model that saves $20,000 and adds two weeks of rework.
Keep Cost of Delay beside TCO. TCO is money you spent. Cost of Delay is value you did not receive.
The Inference Overlay: Cost per Engineer
Inference cost per engineer = total paid inference cost ÷ eligible engineering FTEs
Use the whole eligible population, not only active users. This is not a product outcome. It is the input you plot against product outcome, cycle time, TCO, and Cost of Delay. If inference rises while those measures improve, you may have a productive machine. If inference falls while they deteriorate, procurement saved fuel while the freight stopped moving.
Keep the median and inference-to-labor ratio underneath it to diagnose distribution and set funding stages. Do not turn an adoption failure into a healthy average by counting only the ten people who found the login.
Where Value Density Belongs
Value Density = value-creating engineering cost ÷ total engineering cost × 100
Use Value Density when product outcome, cycle time, or TCO refuses to move. It shows how much capacity became accepted customer value and how much disappeared into waiting, coordination, rework, and recovery.
Value Density can show that 82% of the release dollar was consumed by the system around the work. It cannot tell you whether the remaining 18% built something customers wanted. It explains the result. It does not replace it.
Read the Dashboard in Two Layers
Take a forty-person checkout group with $7.2 million in loaded labor. Conversion is 3.2%. Median cycle time is twenty weeks. Four comparable accepted releases cost $8 million, or $2 million each. Average Cost of Delay is $1 million per release.
Inference is $72,000 a year, 1% of labor or $1,800 per engineer. The pilot says output doubled. If conversion, cycle time, TCO, and Cost of Delay did not move, output did not double. A code-production proxy doubled.
Now run a deliberately hypothetical funded stage, not a recommendation. Inference reaches $3.6 million, or 50% of labor. Conversion rises to 3.8%. Cycle time falls to eight weeks. The group ships eight comparable releases at stable quality. TCO falls to $1.45 million per release and Cost of Delay to $250,000.
The AI bill is enormous compared with the pilot. The economics are also better. Accepted output doubled, TCO per release fell 27.5%, and Cost of Delay fell 75%.
Now make Finance’s payback test explicit. Eight releases at $1.45 million cost $11.6 million, versus the $8 million baseline. Suppose the 0.6-percentage-point conversion gain persists across 20 million qualified checkout sessions and each additional conversion contributes $50 of gross margin. That creates $6 million in annual incremental margin and pays back the additional $3.6 million in about 7.2 months.
Put those assumptions on the dashboard where the CFO can challenge them. Do not add conversion gain to reduced Cost of Delay unless they describe different benefits. Often they are two views of the same value. Counting both does not improve the investment. It only improves the slide.
Do Not Replace the Product Dashboard With an AI Dashboard
Someone will turn $90,000 of inference per engineer into a target. Someone else will cap everyone at $200 a month. One manufactures consumption. The other manufactures scarcity. Neither measures a product.
Start with the number the product exists to move. Add cycle time, TCO, and Cost of Delay. Then overlay inference and ask whether more machine capacity improves the system without degrading quality or risk.
Right now, procurement owns the only number anyone trusts, so it optimizes the invoice. Give the room numbers that describe the product first.
Over the next ninety days, choose one material software value stream with clear acceptance and risk boundaries. Fund three levels of inference. Measure accepted output, TCO, Cost of Delay, quality, and risk at each stage. You have the beginning of a return curve instead of another opinion about what the ratio should be.
The stage gate is simple. Continue only while the incremental economic value of accepted output exceeds the incremental inference and supporting value-stream cost, with quality and risk inside the acceptance boundary. Stop, redesign the workflow, or move the investment when the next dollar no longer improves the economics.
Discover that curve separately for each value stream. A checkout platform, a regulated claims system, and a legacy migration will not share one optimal ratio. Aggregate the curves into a portfolio view only after each value stream has a comparable definition of accepted value, total cost, quality, and risk.
For suitable software workloads, inference is probably the cheapest and fastest way to increase throughput. There is no permanent enterprise-wide optimal ratio. The optimal ratio is the value-stream-specific balance of human judgment, machine capacity, and supporting investment at which another dollar no longer improves the economics of accepted output. It will move as models, prices, products, and governance improve.
The Inference Investment Theory starts with a simple idea: inference is machine labor. It ends with a management obligation: find the optimal ratio for each value stream before procurement finds the smallest invoice.
Procurement can minimize the invoice. Leadership must decide whether the AI mandate is optimizing the bill or the business. Which one did you ask for?


